Connectomics: Modelling The Mind
1. Introduction
Our brain - the jewel of consciousness - is a dynamic function. One that would be UN-PRECEDENTED to model. To model the brain is to simulate it, and simulating the brain could give us the ability to emulate brain disorders, drug development, and possibly one day consciousness.
In light of such a possible future, this piece tries to provide a holistic overview of the current brain emulation research, its methods, milestones, and future directions.
2. Methods
What is popularly known as “brain emulation” is more formally studied as connectomics, a discipline dedicated to creating brain wiring maps (connectomes), with a focus on how synaptic connectivity, cellular morphology, and cellular ultrastructure contribute to the makeup of a network. Since brain activity is defined by structure and function, causal connectomics takes this further and overlays functional information on-top of structural in the aim of achieving a computational brain equivalent – or in cooler terms, a brain upload.
Generally speaking, connectomics research operates at two distinct units of analysis: low-resolution (~macroscale) or high-resolution (~nanoscale). With low-resolution imaging, researchers try to map abstract brain structrue by using top-down functional and structural methods (e.g., MRI, MEG, etc.), to map large fiber tracts and gray matter regions within the brain, analyzing things like blood flow for functional insights and water diffusivity for structural details.
On the other hand, high-resolution connectomics focuses on mapping the brain at a mechanistic level – capturing all the substrate at the maximum obtainable resolution, both through structural methods (e.g., microscopy, histology, etc.) and functional methods (e.g., calcium imaging, array tomography, etc.) – all in the vein of creating the finest digital reconstructions of the organism.
An important distinction between low vs high-res brain imaging apart from fidelity is their invasiveness. High-res imaging is hyper invasive as it often requires physically cutting the brain into micrometer-thick slices and imaging each individually, like in serial scanning electron microscopy (SSEM). This method, though fatal to the organism, provides unprecedented fidelity required for high-precision uploading. On the other end of the spectrum, low-res imaging like MRI works on live organisms, but as a result fails to capture the mechanistic details required to accurately simulate a brain. There tends to be a clear correlation between invasiveness and the amount of information you can extract in connectomics, and until we develop non-invasive imaging methods with nanoscale resolution, methods like SSEM will be most promising for detailed brain mapping.
2.1 Nanoscale Connectomics
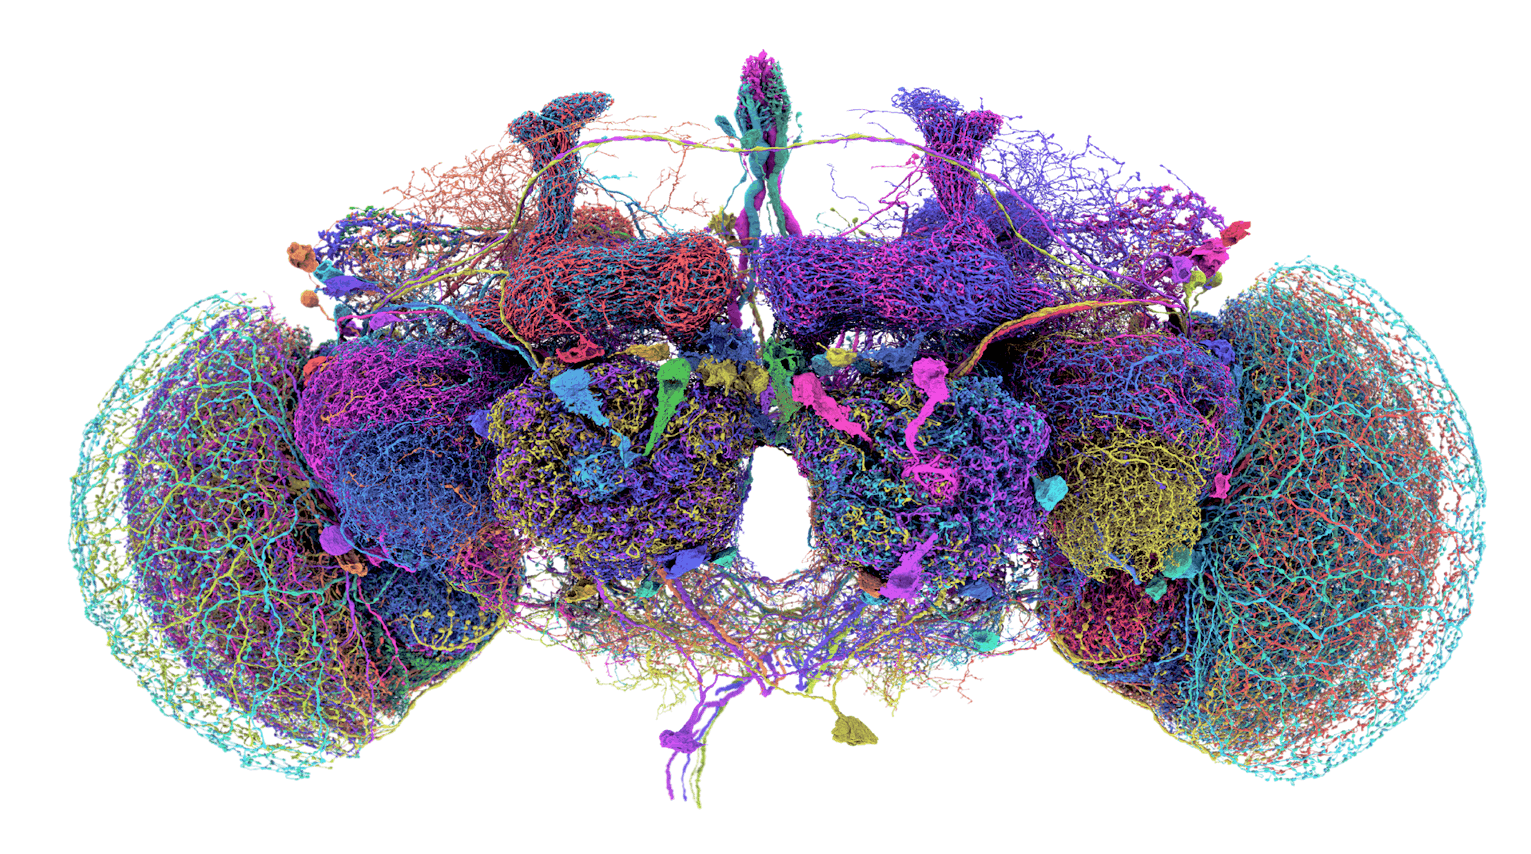
In high-res (nanoscale) connectomics, the goal is to obtain tiny mechanistic maps of neuron-to-neuron, synapse-to-synapse connectivity. Electron microscopy (EM) is the tool of choice here thanks to its awesome ~3-5nm precision, which is sufficient for imaging neurons down to their synapses. The issue with traditional optical microscopes is that they can’t image samples below 200-300nm due to the diffraction limit of light. Instead, the EM works by bombarding heavy metal-stained tissue samples (typically with osmium, uranium, and lead) with accelerated electrons and detecting differential scattering of electrons between subcellular structures (think: cellular membranes, dendrites, synaptic vesicles, etc.,) all of which have differing electron densities. Despite their stellar resolution EM microscopes are expensive (~$2M) and really slow (imaging rate of ~10-100 μm³/s) due to beam dwell time, serial sectioning, and heavy metal staining overheads.
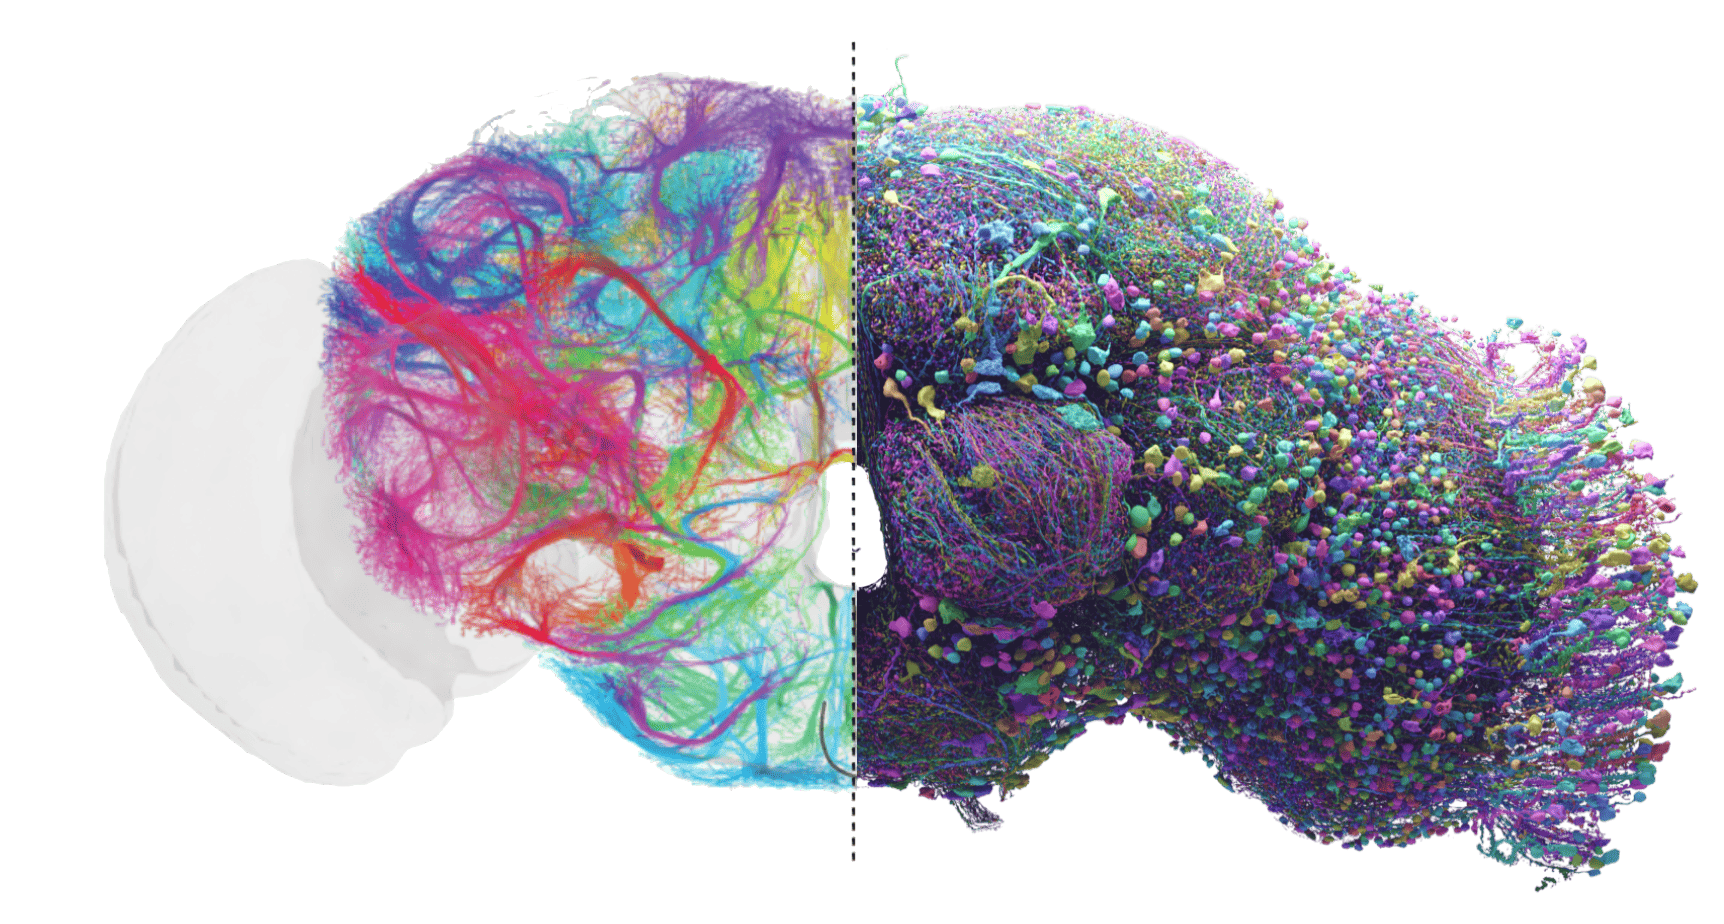
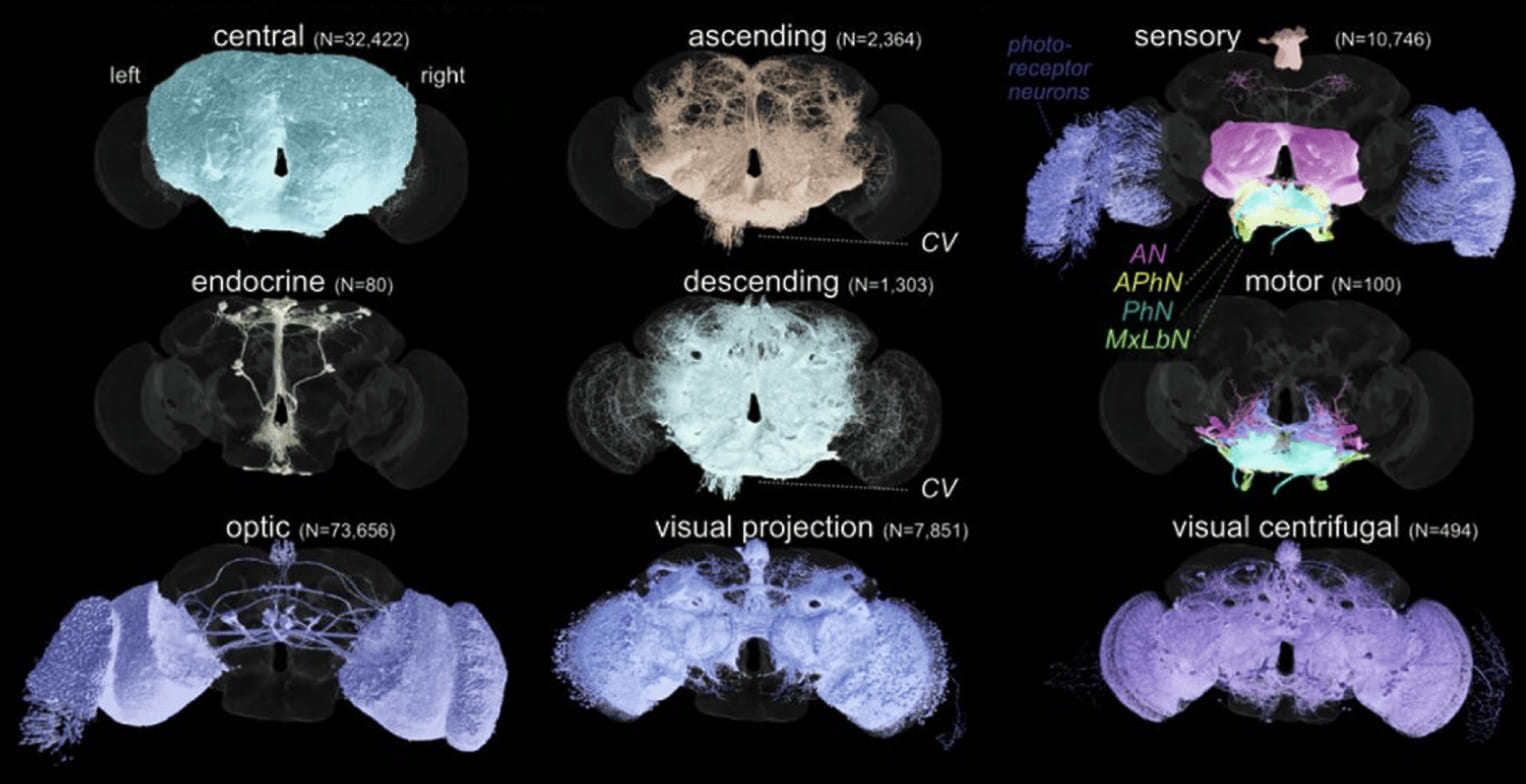
Figure 2: Connectome of a fruit fly (Drosophila melanogaster) obtained using Electron Microscopy, showing different neuronal types. The connectome consists of 140,000 neurons and is the size of a grain of sand.
Alternatively to using very expensive and slow electron microscopes to elucidate the structure, we can expand the brain itself and image it with a standard microscope! Expansion Microscopy (ExM) is a method which allows to, quite literally – physically enlarge the tissue ~20x while maintaining its structural relationships. ExM works by embedding tissue in a swellable polymer (like a baby diaper matrix) that expands uniformly when you add water, increasing the physical size of the specimen whilst preserving its composition. The beauty of ExM is that the physical magnification enables imaging of tissue at the nanoscale using standard light microscopes.
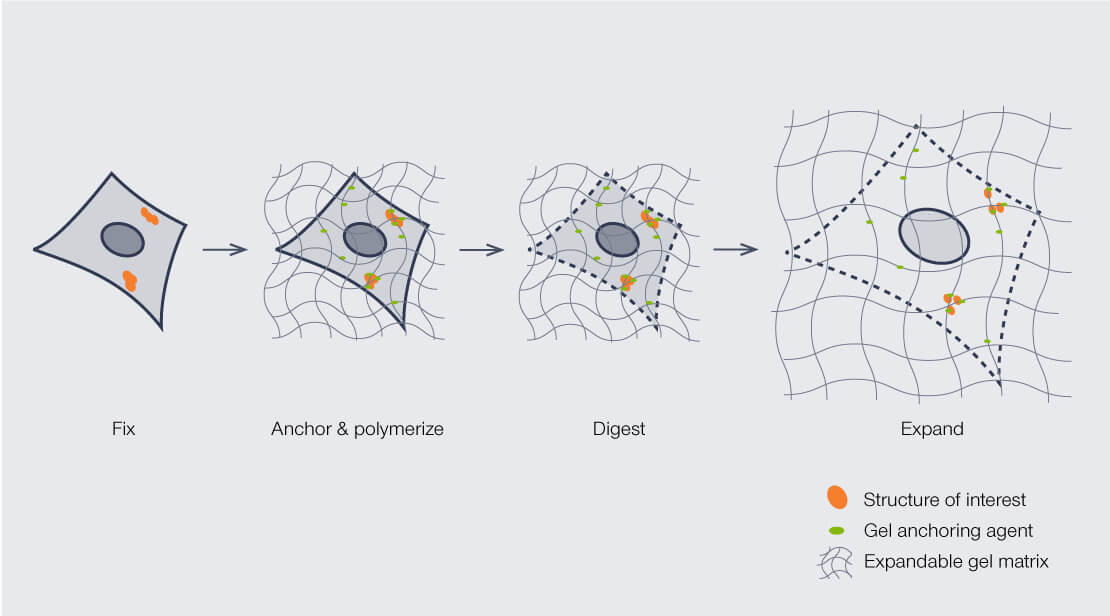
Figure 3:Expansion Microsope Proceedure.
Unarguably one of the most futuristic connectomics methods is to use a particle collider called Synchrotrons to image the tissue via X-ray nanotomography. Synchrotron’s appeal lies in its ability to bypass the need for heavy metal staining and physical sectioning unlike in electron microscope. The way it works is by accelerating electrons to near light speed, and then bending them to obtain incredibly potent X-ray beams (up to 10¹² photons/second) that are filtered to desired energy levels between 8-12 keV. Unlike conventional X-ray imaging that detects how tissues block X-rays, synchrotron-based connectomics measures how X-rays bend or phase shift when passing through brain sample due to different tissue refractive indices. This reveals unmyelinated axons and cell boundaries without staining. In theory, a synchrotron can image a full human brain in less than a year at ~40nm resolution, which is faster than using 350 electron microscopes in parallel!
Numerous other brain imaging techniques exist and are in the making, but that’s a conversation for another rabbithole.
2.1 Macroscale Connectomics
Macroscale connectomes are typically mapped using diffusion-weighted magnetic resonance imaging (dMRI) and functional magnetic resonance imaging (fMRI). dMRI is like the Google Maps of the brain, charting the main highways of white matter that connect the cortex to the subcortex. It does so by tracking the diffusion of water molecules, which reveal the orientation of these neural pathways. When paired with tractography, dMRI doesn’t stop at mapping, and reconstructs the brain’s white matter tracts by measuring water diffusion in multiple directions, estimating local fiber orientations, and modeling the brain’s fiber pathways. Tractography algorithms then take the baton, tracing the probable routes of these pathways to sketch out the brain’s anatomical connectivity. From this data, we can extract metrics like fractional anisotropy (FA), mean diffusivity (MD), and connectivity strength, which help us assess the microstructural properties of white matter and quantify the robustness of long-range connections between brain regions.
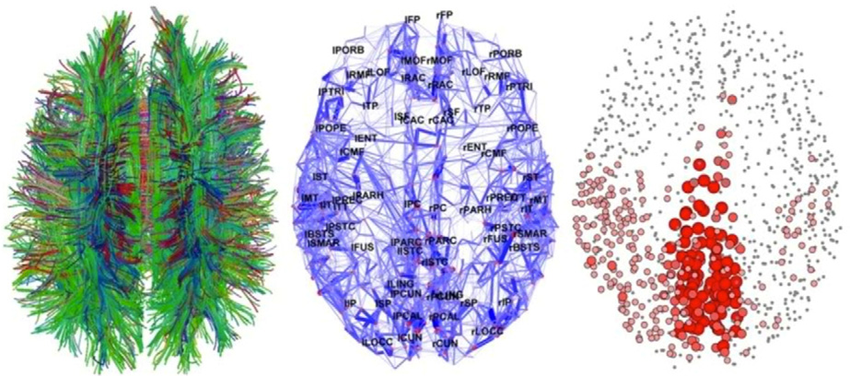
Figure 4: High-level human brain connectome is mapped in a three-step process: 1. Diffusion-weighted MRI (dMRI) is used to chart the brain's white matter tracts. 2. Tractography algorithms establish the edges by tracing these pathways. 3. Nodes are defined by identifying brain regions connected by the edges.
2.3 Simulating
Once you have the brain imaging data, the next step is to turn it into a functioning model. Though there isn’t a definitive solution to converting data into simulations, The most standard procedure is as follows:
| Step | Description |
|---|---|
| 1. Pre-Processing | • Aligning all the imaged slices correctly into a 3D volume |
| • Removing of artifacts | |
| 2. Segmentation & Proofreading | • Segmenting tissue using ML models (U-nets, flood filling networks, local shape descriptors) to outline cell bodies, trace axons, dendrites, and synaptic connections |
| • Proofreading and correcting errors of automated segmentation (incorrect connections, missed branches, and false mergers) | |
| • In barcoded specimens: using molecular barcodes to verify neuron identity and connections | |
| 3. Classification | • Classification and labelling of cell types (glia, astrocytes, etc.) |
| 4. Connectome Graph Creation | • Converting the 3D reconstruction into a structured graph representation |
| • Defining nodes (neurons) and edges (synaptic connections) | |
| • Adding metadata about neuron types, molecular properties and synaptic strengths | |
| 5. Simulation Model Building | • Choosing neuron models and parameters (LIF, Hodgkin-Huxley, etc.) |
| • Setting neurotransmitter types and receptor responses | |
| • Implementing neuroplasticity mechanisms based on available data (short & long-term plasticity) | |
| 6. Environment/Body Integration | • Connecting sensory inputs to appropriate neurons |
| • Mapping motor outputs to effectors | |
| • Creating physical model of environment for interaction | |
| 7. Execution | • Setting up infrastructure (partitioning the network across GPUs, setting up memory management, etc.) |
| • Initializating (membrane potential, ion concentration, etc.) | |
| • Validation testing (comparing actual brain's neural activity patterns to the model) | |
| 8. Parameter Calibration | • Tuning nueorn parameters based on functional data (calcium/voltage/etc., imaging) |
| • Calibrating neuroplasticity rules based on available data |
Table 1: The key steps of the brain simulation procedure, from initial tissue imaging preparation to final model calibration. The steps consecutively build on each other to create a complete digital representation of the original brain.
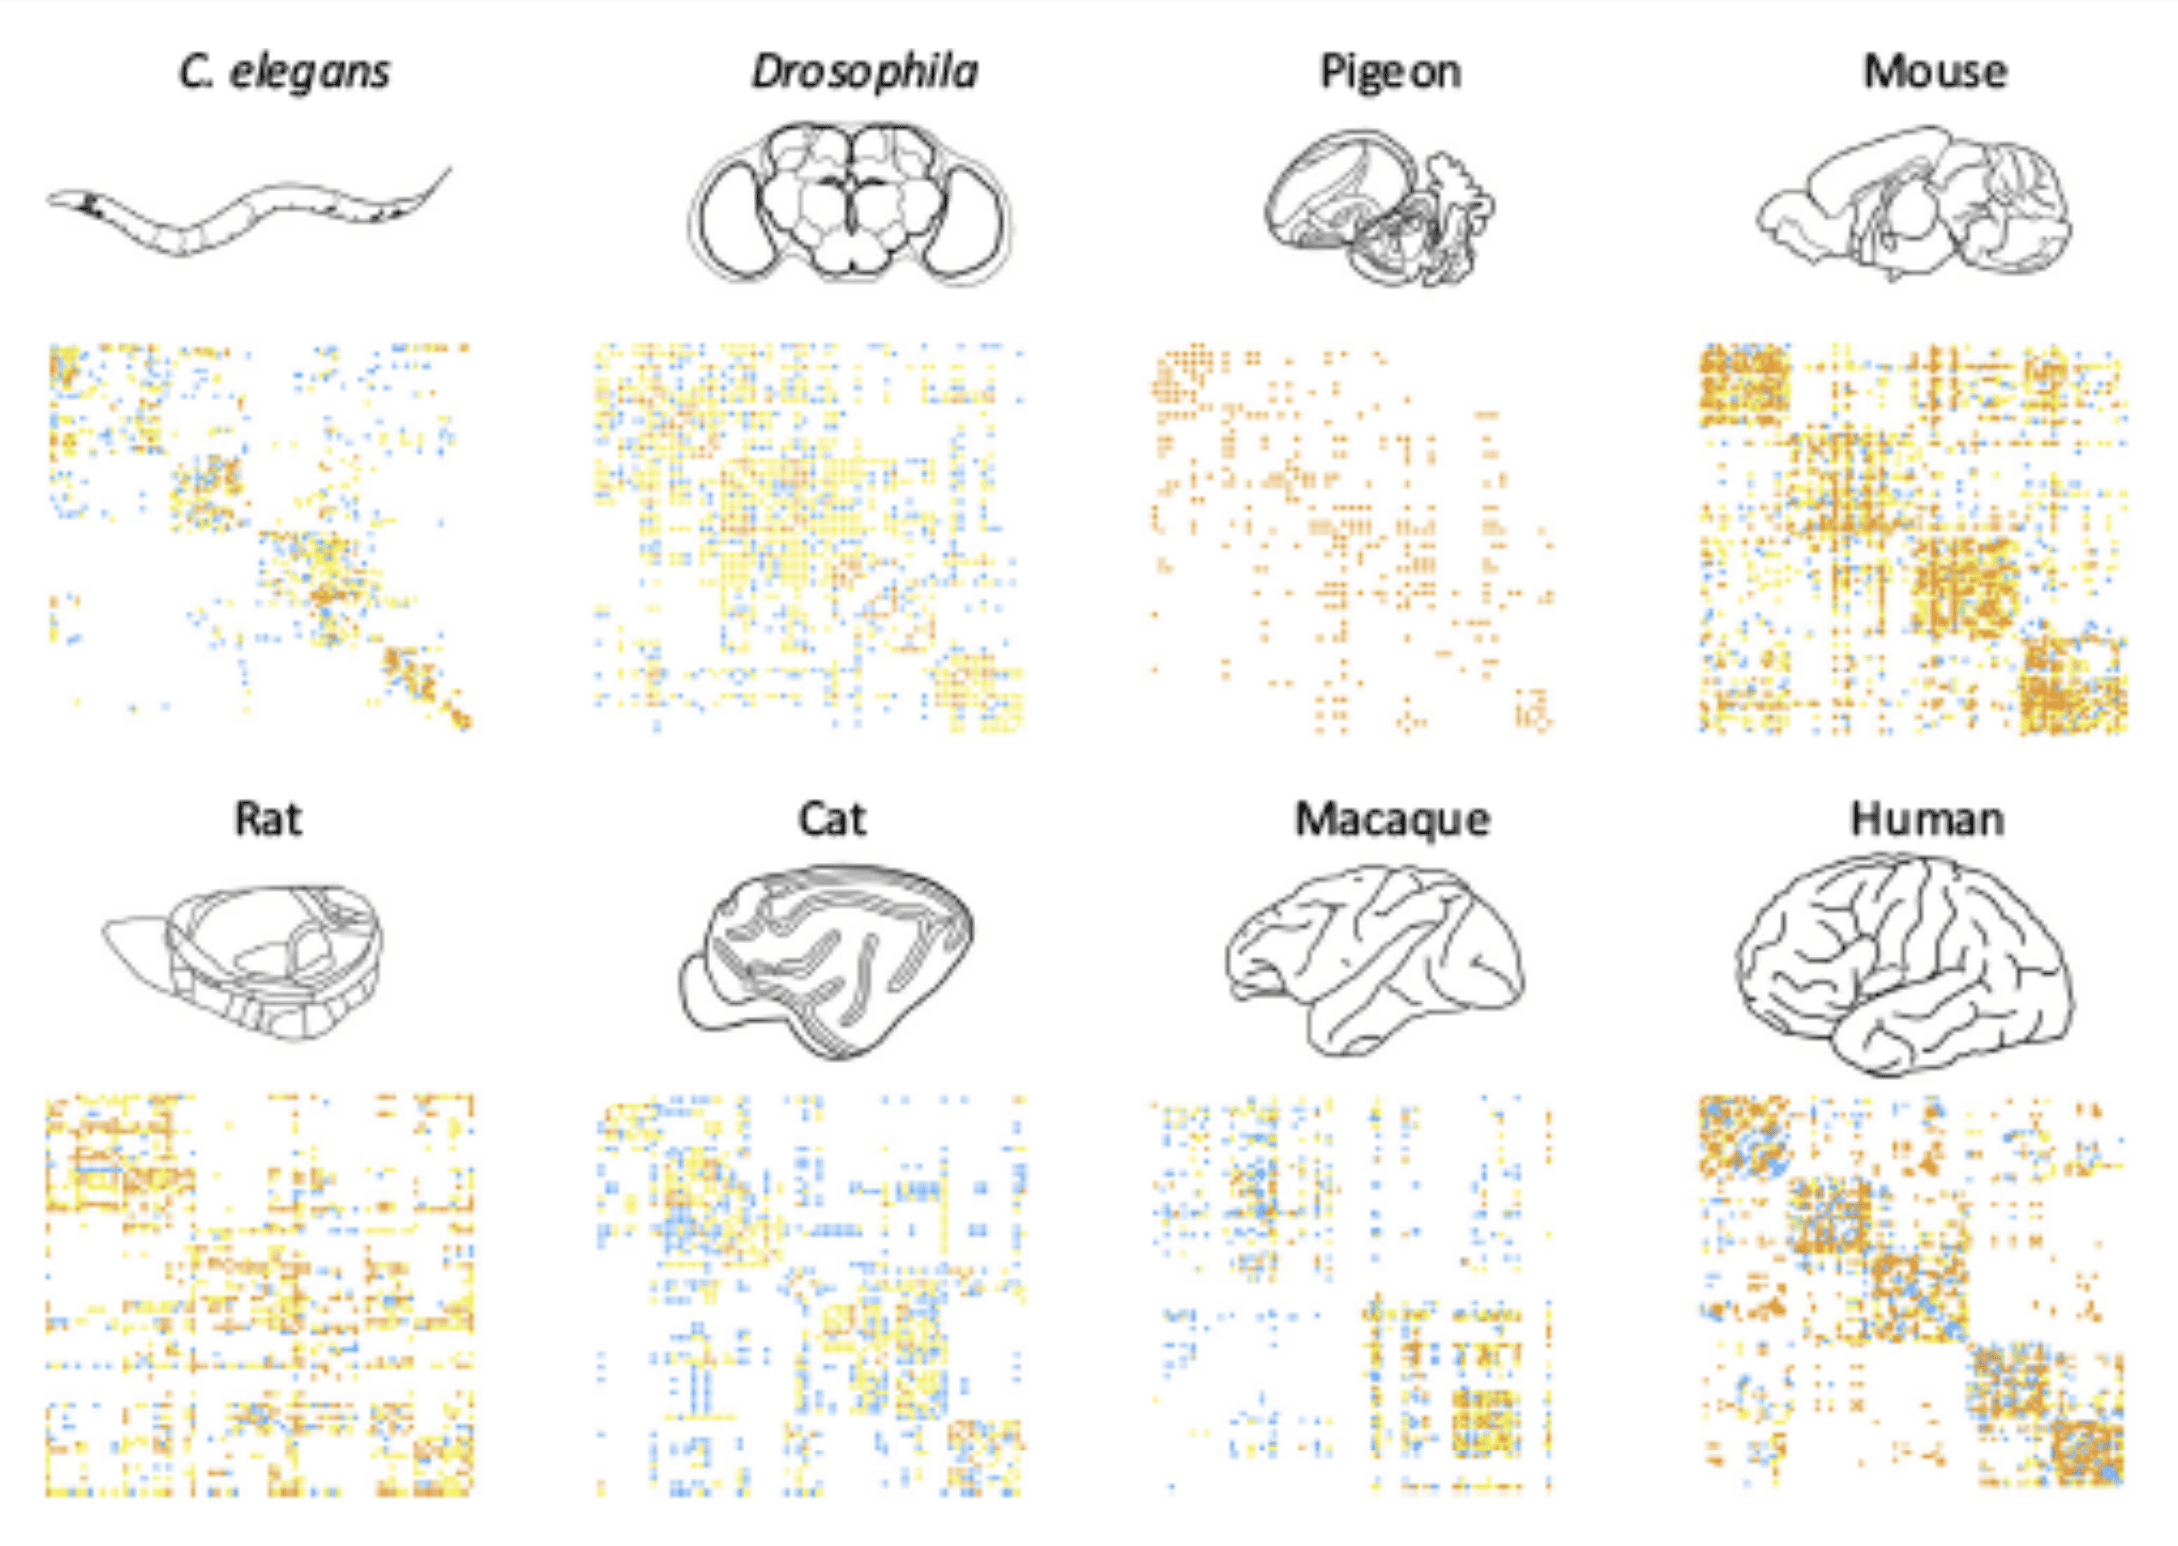
Figure 5: Connectivity matrices of different species obrained through structural imaging. These matricies are then used as bedrocks for building simulation models.
4. Progress
Some of the highlight organisms uploaded to date:
3.1 Caenorhabditis Elegans
Back in 1986, the first full nervous system connectome was painstakingly mapped for a C.elegans (CE) worm, using hand-annotated electron microscopy. The work kicked off a series of CE investigations that ended up winning a Nobel prize in 2002. This worm became a staple in neuroscience for it’s simplicity of having just 302 neurons & 5000 synaptic connections. Today, we can simulate CEs down to a synapse using the most accurate biophysical models on hand. Despite being a useful and simple organism, CEs turned out to lack the complex electrophysiological properties and synaptic plasticity that are the hallmarks of human neurons. In short, it’s an interesting organism, but now insightful enough. Thus, when compute, AI and microscopes allowed for it, researchers jumped on to mapping next promising organism - the fruit fly.
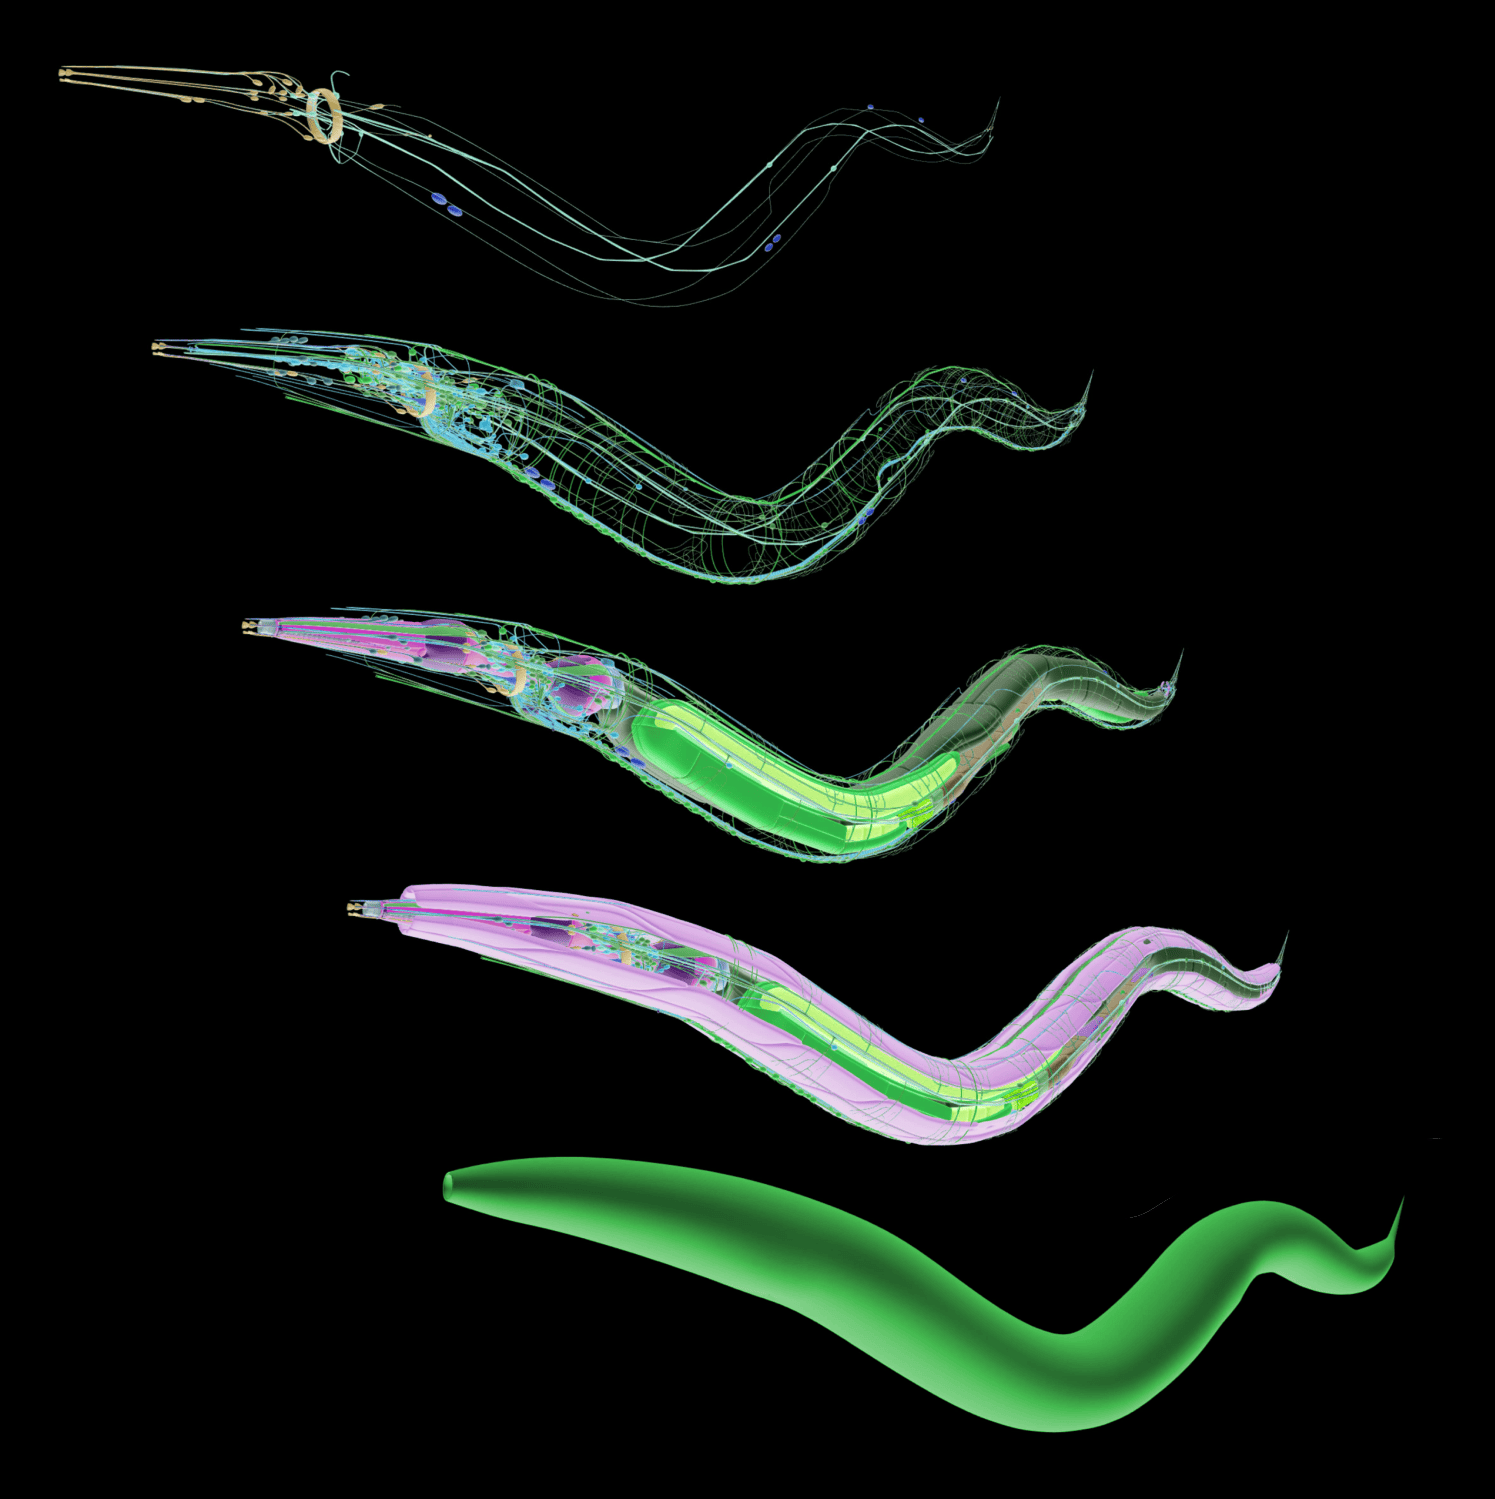
Figure 6:Connectome of a C.elecan
3.2 Fruit Fly
The next uploaded brain followed to be that of a fruit fly Drosophila. This was snapped using a higher-throughput ssTEM pipeline and segmented by a separate lab using an automated CNNs pipeline which allowed the field to jump from a mere 302 neurons and 5000 synaptic connections to ~100,000 neurons and 20 million synaptic connections (a 330 and 4,000-fold increase respectively). Unlike C. elegans, Drosophila exhibits complex cognitive behaviors including associative learning, sleep regulation, and decision-making that involve neural circuits with organizational principles shared with mammals. These mechanics make the fly connectome particularly interesting to simulate since they provide testable models for understanding how neural circuits integrate behaviors similar to human brain dynamics. It goes without saying that evolutionarily we are still vastly different, and thus ought to move closer to the human objective.
3.3 Mouse
Moving up the evolutionary tree, researchers have recently mapped a cubic millimeter of mouse visual cortex—a landmark achievement known as the MICrONS (Machine Intelligence from Cortical Networks) project. This cubic millimeter contains approximately 120,000 neurons and 650 million synapses, representing another scale jump from the fruit fly. Critically, this volume is large enough to capture complete local circuits and long-range projections that implement visual processing computations analogous to those in humans. Another fancy part is that the mouse brain architecture shares fundamental cortical organization, cell types, and circuit motifs with human brains.
More interestingly, building on this success, the Intelligence Advanced Research Projects Activity (IARPA) has now launched an even more ambitious project called MICrONS Petascale, aiming to map the complete mouse brain of approximately 70 million neurons with hundreds of billions of connections. That will require processing exabytes of imaging data and is expected to be a human genome level insights bombshell.
3.4 Human
As for uploading us – humans, there has been just as much work put into digitizing our brain.
At the low-res connectomics: The Human Connectome Project (HCP), launched in 2009, mapped structural connectivity using diffusion MRI tractography to trace white matter pathways and functional connectivity using resting-state fMRI to identify correlated activity patterns. Though it operates at millimeter resolution and thus doesnt allow to simulate the brain accurately, it mapped out the whole-brain coverage across all cortical and subcortical regions in about 1,200+ living humans which provides context about brain’s architecture that will be usefull coming forth in nanoscale brain mapping.
As for high-res mapping: The first human nanoscale brain connectome milestone came in 2022-2023 with the mapping of a cubic millimeter of temporal cortex tissue from a neurosurgical sample. This “H01” dataset, produced by Harvard’s Lichtman lab in collaboration with Google Research mapped approximately 50,000 neurons and 130 million synapses (1/1,000,000th of our brain size). Small volume? Yep. But thats how the start of acceleration towards full human brain uploading looks like.
4. Path Forward
To witness human emulations within the next decade three key disciplines need “unhobbling”:
| Domain | Current Limitations | Innovations Needed | Urgency /10 | Feasibility /10 |
|---|---|---|---|---|
| Software | • Compression algorithms |
• Specialised compression algorithms for neuronal data. [Sparse matrix compression achieving 100x-150x compression of the original dataset] |
7 | 10 |
| • Simulation environments |
• Holistic simulation engine. [Integration of sensory and motor systems with simulated brains, modelling neuro-plasticity, etc.,] • Without simulations the field will not catch attention or find viability, making it imperative. |
9 | 8 | |
| • Benchmarks |
• Standardized metrics to validate simulations. [Benchmarks to validate simulation accuracy and "human-likeness"] |
8 | 10 | |
| • Neuron segmentation and proofreading |
• AI reconstruction models with better attention mechanics. [Current neuron reconstruction accounts for 95% of connectomics costs due to human leabelling need. Automated proofreading will solve this] |
9 | 10 | |
| Hardware | • Electron microscope cost and speed |
• Cheaper and faster EMs [2x cost reduction (\$2M ➝ \$1M) and 10x-20x imaging speed increase (~50μm³/s ➝ 1000μm³/s) would make EM imaging feasible] |
10 | 7 |
| • Data storage cost |
• Exascale data centres. [10x reduction in data storage cost would be helpful (from \$200M ➝ \$20M) for a 100x compressed human connectome. Generally there is a 10x-per-decade cost reduction in data storage by default, but can we speed it up?] |
10 | 5 | |
| • Compute cost |
• Brain-like neuromorphic/biohybrid computing or cheaper GPU clusters. [Cheaper mass compute will be neccessary. 1:1 biophysical simulations will require up to ~5.5×10²⁰ FLOP/s. Mores law will reduce prices by default, but can we design more brain-like hardware to speed it up?] |
7 | 5 | |
| • Manual wetlab work |
• Automated robotics wetlab [Cutting, imaging and staning apparature which will allow to increase the complexity of wetlab protocols whilst removing human error] |
4 | 7 | |
| • Destructive sample imaging |
• Non-destructive nanoscale imaging method [Imaging akin to nanoscale muon-tomography which can non-invasively scan the brain down to a synapse] |
10 | 3 | |
| Wetware | • Expansion microscopy magnification |
• Faster expansion microscopy protocols [Current ExM protocols achieves 10-40x expansion (25x = ~20nm) which is already enough, yet getting a consistent isotropic 40x zoom would equate it to EM resolution] |
6 | 8 |
| • Lack of electron microscopy staining protocols |
• Staining protocols for EM imaging. Incomplete molecular characterization during electron microscopy imaging means we miss functional details of the upload. This is an issue with electron and synchrotron imaging, but not expansion microscopy. |
7 | 6 | |
| • Scalability of protein profiling | • More scalable protein barcoding protocols. [Current protocols require multiple rounds of staining/washes and need testing on larger organisms] | 10 | 8 | |
| • Scalability of functional nanoscale imaging |
• New nanometer functional imaging methods that can scale to whole brain neuron populations [Current methods like voltage imaging, calcium imaging, etc., are either indirect, damaging or unscalable to whole brains. Thus methods like fUS with ~15 micrometers theoretical limit that scale to larger neuron populations could be the remedy] |
10 | 6 |
Table 2: The key limitations and corresponding innovations required across software, hardware, and wetware domains to advance connectomics toward complete brain uploading. These are some of the most common limitations and innovations raised by dozens of connectomics researchers I interviewed. The numerics of the table are largely based on fermi estimates of my own as well as of my colleagues from MIT, and should be viewed as educated guesess.
Considering that software, hardware and wetwear sectors are accelerating nonlinearly, it is probable that each of those innovations will be reached this very decade. The first uploaded intelligence effort will likely cost $1-$10 billion — prohibitive for most — but like the human genome project which plummeted from $3 billion to $400, it should come as no surprise that brain uploads too will likely drop in price by orders of magnitude within a few years after the first upload. I hope you are excited.
5. Conclusion
There is an invisible path to the first human uploads. Cost, fidelity and speed of connectomics are still to give way to this future, but once they do, massive GPU orchestras will buzz the melody of the first human AIs.